 English
 Français
 日本語
日本語 中文
中文Kamoa-Kakula ranks among the world’s 10 largest copper
deposits – and stands as the world’s largest, high-grade copper
deposit – following a new Mineral Resource estimate
Kakula – the second major discovery at Kamoa – contains
Indicated Mineral Resources estimated at 66 million tonnes
at 6.59% copper plus Inferred Resources of 27 million tonnes
at 5.26% copper, at a 3% cut-off
Kakula also contains Indicated Mineral Resources estimated
at 192 million tonnes at 3.45% copper plus Inferred Resources
of 101 million tonnes at 2.74% copper, at a 1% cut-off
Kakula’s addition boosts the combined Kamoa-Kakula
Indicated Mineral Resources to 944 million tonnes
at 2.83% copper plus Inferred Resources of 286 million tonnes
at 2.31% copper, at a 1% cut-off
KOLWEZI, DEMOCRATIC REPUBLIC OF CONGO – Robert Friedland, Executive Chairman of Ivanhoe Mines (TSX: IVN), and Lars-Eric Johansson, Chief Executive Officer, announced today that the company has completed an independently verified, initial Mineral Resource estimate for the extremely-high-gradeKakula Discoveryon the Tier One Kamoa Copper Project, near the mining centre of Kolwezi in the Democratic Republic of Congo (DRC). The Kamoa-Kakula Project is a joint venture between Ivanhoe Mines, Zijin Mining and the Government of the Democratic Republic of Congo.
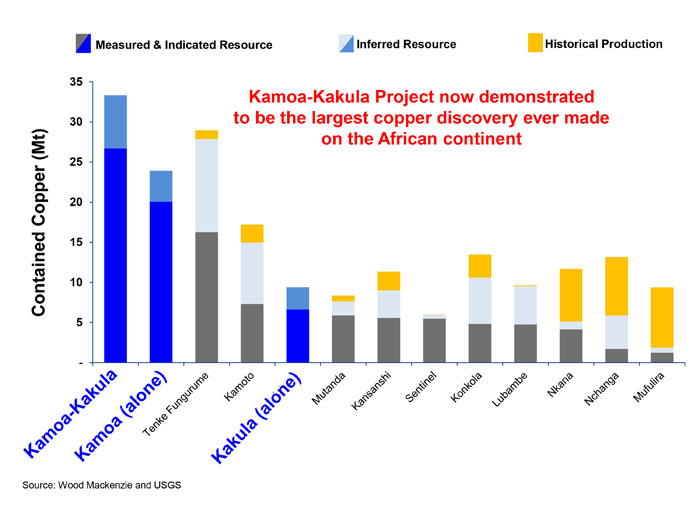
Kakula is the second major discovery on the Kamoa mining licence in the past eight years. Now, with the addition of Kakula’s Mineral Resources, research by Wood Mackenzie – a prominent, international industry research and consulting group, based in the U.K. – has independently demonstrated that the Kamoa-Kakula Project is the largest copper discovery in Zambia and the DRC, making it the largest copper discovery ever made in the history of mining on the African continent. In addition, research by Wood Mackenzie also shows that Kamoa-Kakula already ranks among the 10 largest copper deposits in the world.
“With the initial resource now established, we are evaluating technical and infrastructure options to rapidly advance the development of the near-surface, highest-grade copper resources at Kakula,” said Mr. Friedland. “Our mine planning will focus on how to expeditiously develop the zones of thick, bottom-loaded chalcocite, grading in excess of 6% copper, near the centre of Kakula’s high-grade area.
“Given that the copper grades at Kakula are significantly higher than the average grades found elsewhere at Kamoa, we are highly confident that fast-tracking the development of Kakula will have a profound and positive impact on the economics of the overall Kamoa-Kakula Project.”
The 60-square-kilometre Kakula Exploration Area is approximately 10 kilometres southwest of Kamoa’s initial mine development presently underway at the Kansoko Sud Discovery (see Figure 1). Ivanhoe and Zijin have been conducting an aggressive drilling program at the Kakula exploration target since April 2016. More than 31,000 metres of drilling already have been completed. Given the outstanding success to date in delineating high-grade copper resources, the Kakula drilling program has been expanded by 60,000 metres and will continue unabated into 2017.
Highlights of the initial Kakula Mineral Resource estimate, prepared by Ivanhoe Mines under the direction of Amec Foster Wheeler E&C Services Inc. (Amec Foster Wheeler), of Reno, Nevada, in accordance with the 2014 CIM Definition Standards for Mineral Resources and Mineral Reserves:
- Indicated Resources total 192 million tonnes at a grade of 3.45% copper, containing 14.6 billion pounds of copper at a 1% copper cut-off. At a 2% copper cut-off, Indicated Resources total 115 million tonnes at a 4.80% copper grade, containing 12.1 billion pounds of copper. At a higher cut-off of 3% copper, Indicated Resources total 66 million tonnes at a grade of 6.59% copper, containing 9.6 billion pounds of copper.
- Inferred Resources total 101 million tonnes at a grade of 2.74% copper, containing 6.1 billion pounds of copper at a 1% copper cut-off. At a 2% copper cut-off, Inferred Resources total 51 million tonnes at a 3.92% copper grade, containing 4.4 billion pounds of copper. At a higher cut-off of 3% copper, Inferred Resources total 27 million tonnes at a grade of 5.26% copper, containing 3.2 billion pounds of copper.
- The average true thickness of the selective mineralized zone (SMZ) at a 1% cut-off is 14.27 metres in the Indicated Resources area and 10.33 metres in the Inferred Resources area. At a higher 3% cut-off, the average true thickness of the SMZ is 5.91 metres in the Indicated Resources area and 5.15 metres in the Inferred Resources area.
This Kakula Mineral Resource has been defined by drilling covering a total area of 8.7 square kilometres within the larger 60-square-kilometre Kakula Exploration Area. The total areal extent of Indicated Resource is 4.6 square kilometres at a 1% cut-off and the areal extent of the Inferred Resource is 3.3 square kilometres at a 1% cut-off. The average dip of the mineralized zone in the Indicated Resource area is 13 degrees, while the average dip is 16 degrees in the Inferred Resource area.
Mineralization is open along trend to the northwest and the southeast, while the remainder of the Kakula exploration area remains untested (see Figure 2). The Mineral Resource estimate is based on the results from approximately 24,000 metres of drilling in 65 holes. An additional 13 holes totalling more than 7,000 metres have been completed and assay results are pending.
Indicated Resources are defined when the drill-hole spacing approximates a 400-metre grid, while Inferred Resources are defined when the drill-hole spacing approximates an 800-metre grid.
The Kakula Mineral Resource estimate was prepared by Ivanhoe Mines under the direction of Dr. Harry Parker and Gordon Seibel, both RM SME, of Amec Foster Wheeler. Dr. Parker and Mr. Seibel are the Qualified Persons for the estimate, which has an effective date of October 9, 2016. A technical report will be filed on SEDAR at www.sedar.com and on the Ivanhoe Mines website at www.ivanhoemines.com within 45 days of the issuance of this news release.
The Kakula Mineral Resources, along with sensitivities at various cut-offs, are shown in tables 1, 2 and 3.
Table 1. Indicated and Inferred Mineral Resources at a 1% cut-off grade, Kakula Discovery.
| Category | Tonnage (Mt) |
Area (km2) |
Copper (%) |
True Thickness (metres) |
Contained Copper (kTonnes) |
Contained Copper (billion lbs) |
|---|---|---|---|---|---|---|
| Indicated | 192 | 4.6 | 3.45 | 14.3 | 6,630 | 14.6 |
| Inferred | 101 | 3.3 | 2.74 | 10.3 | 2,763 | 6.1 |
Notes:
- Ivanhoe’s Mineral Resources Manager George Gilchrist, a Member of the Geology Society of South Africa and Professional Natural Scientist (Pr. Sci. Nat) with the South African Council for Natural Scientific Professions (SACNASP), estimated the Mineral Resources under the supervision of Dr. Harry Parker and Gordon Seibel, both RM SME, who are the Qualified Persons for the Mineral Resources. The effective date of the estimate is October 9, 2016. Mineral Resources are estimated using the CIM Definition Standards for Mineral Resources and Reserves (2014).
- For the Kakula Discovery, Mineral Resources are reported using a total copper (TCu) cut-off grade of 1% TCu and an approximate minimum thickness of 3 metres. A 1% TCu cut-off is a natural cut-off grade on the Central African Copperbelt. There are reasonable prospects for eventual economic extraction under assumptions of a copper price of US$3.00/lb, employment of underground, mechanized, room-and-pillar and drift-and-fill mining methods, and that copper concentrates will be produced and sold to a smelter. Mining costs are assumed to be $38/t. Concentrator and General and Administrative (G&A) costs are assumed to be $19/t. Metallurgical recovery is assumed to be 77% at the 1% TCu cut-off and 88% at the average grade of the Mineral Resource.. Ivanhoe is studying (Preliminary Economic Assessment in progress) reducing mining costs using a convergence backfill method
- Reported Mineral Resources contain no allowances for hanging wall or footwall contact boundary loss and dilution. No mining recovery has been applied.
- Rounding as required by reporting guidelines may result in apparent differences between tonnes, grade and contained metal content.
Table 2. Kakula Discovery Indicated Mineral Resources, Sensitivity Cases.
| Category | Cut-off Grade (Cu%) |
Tonnes (millions) |
Area (Sq. km) |
Copper Grade | True Thickness (metres-m) |
Contained Copper (kTonnes) |
Contained Copper (billion lbs) |
|---|---|---|---|---|---|---|---|
| Indicated | 7.0 | 27 | 1.4 | 8.25% | 6.3 (m) |
2,242 | 4.9 |
| Indicated | 6.0 | 42 | 2.1 | 7.69% | 6.6 (m) |
3,220 | 7.1 |
| Indicated | 5.0 | 51 | 2.7 | 7.29% | 6.5 (m) |
3,711 | 8.2 |
| Indicated | 4.0 | 62 | 3.4 | 6.78% | 6.1 (m) |
4,211 | 9.3 |
| Indicated | 3.0 | 66 | 3.8 | 6.59% | 5.9 (m) |
4,351 | 9.6 |
| Indicated | 2.5 | 75 | 4.0 | 6.13% | 6.3 (m) |
4,579 | 10.1 |
| Indicated | 2.0 | 115 | 4.3 | 4.80% | 9.2 (m) |
5,504 | 12.1 |
| Indicated | 1.5 | 139 | 4.4 | 4.24% | 10.9 (m) |
5,899 | 13.0 |
| Indicated | 1.0 | 192 | 4.6 | 3.45% | 14.3 (m) |
6,630 | 14.6 |
Table 3. Kakula Discovery Inferred Mineral Resources, Sensitivity Cases.
| Category | Cut-off Grade (Cu%) |
Tonnes (millions) |
Area (Sq. km) |
Copper Grade | True Thickness (metres-m) |
Contained Copper (ktonnes) |
Contained Copper (billion lbs) |
|---|---|---|---|---|---|---|---|
| Inferred | 7.0 | 1 | 0.1 | 7.47% | 4.2 (m) |
72 | 0.2 |
| Inferred | 6.0 | 8 | 0.4 | 6.50% | 6.2 (m) |
490 | 1.1 |
| Inferred | 5.0 | 18 | 0.9 | 5.89% | 6.4 (m) |
1,076 | 2.4 |
| Inferred | 4.0 | 23 | 1.3 | 5.60% | 5.8 (m) |
1,283 | 2.8 |
| Inferred | 3.0 | 27 | 1.8 | 5.26% | 5.2 (m) |
1,445 | 3.2 |
| Inferred | 2.5 | 31 | 2.0 | 4.98% | 5.2 (m) |
1,537 | 3.4 |
| Inferred | 2.0 | 51 | 2.2 | 3.92% | 7.7 (m) |
2,018 | 4.4 |
| Inferred | 1.5 | 75 | 2.6 | 3.21% | 9.8 (m) |
2,412 | 5.3 |
| Inferred | 1.0 | 101 | 3.3 | 2.74% | 10.3 (m) |
2,763 | 6.1 |
High-grade Kakula Discovery presents game-changing opportunities for Kamoa-Kakula development
Mineralization at Kakula is substantively thicker and higher grade than elsewhere on the Kamoa mining licence; it also is consistently bottom-loaded and will support the construction of selective mineralized zone (SMZ) composites at cut-offs up to at least 3% copper. The lateral consistency of mineralization at these higher cut-offs presents significant opportunities for mine planning, with large areas of the resource having average grades in excess of 6% when using the 3% SMZ.
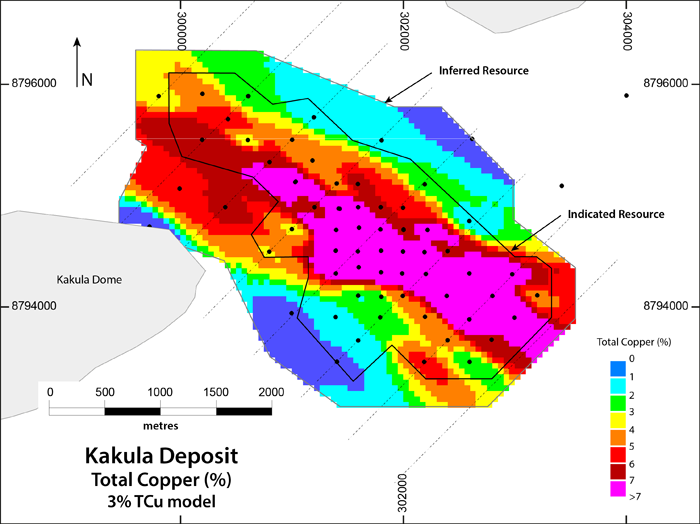
The Kakula resource model was constructed using a series of nested grade shells at 1%, 2% and 3% cut-offs. A minimum thickness of 3.0 metres was applied to the 3% grade shell and the outer shells were nested above and below this central shell. The resultant model allows the flexibility to show distribution of grades and thicknesses across the various grade shells and highlight Kakula’s outstanding, high-grade potential.
Figures 3 and 4, below, show the distribution of grades and thicknesses across the 3% copper shell, while figures 5 and 6 show the distribution of thicknesses and grades across the base-case 1% copper shell.
Kakula Exploration Area provides significant potential for resource expansion.
The Kakula Discovery remains open along a northwesterly-southeasterly strike and there is considerable potential for resource expansion within the Kakula Exploration Area. High-grade copper mineralization has been outlined along a corridor that is currently approximately one kilometre wide and at least four kilometres in length. This high-grade corridor lies within an area of 8.7 square kilometres over which resources have been delineated.
Encompassing the area of defined resources, the highly-prospective, 66-square-kilometre Kakula Exploration Area remains largely unexplored (see Figure 2). Four drill rigs are focusing on expanding the Inferred Resource, drilling step-out holes to the southeast and northwest of Kakula’s currently defined high-grade core. One rig is drilling infill holes to expand the Indicated Mineral Resource, while a sixth rig is focusing on shallow drilling to define stratigraphy and the weathering profile in the area outlined for a potential box cut.
Figure 1. Kamoa-Kakula Project map shows the planned initial mining area at Kansoko Sud and the adjacent Kakula Discovery exploration area.
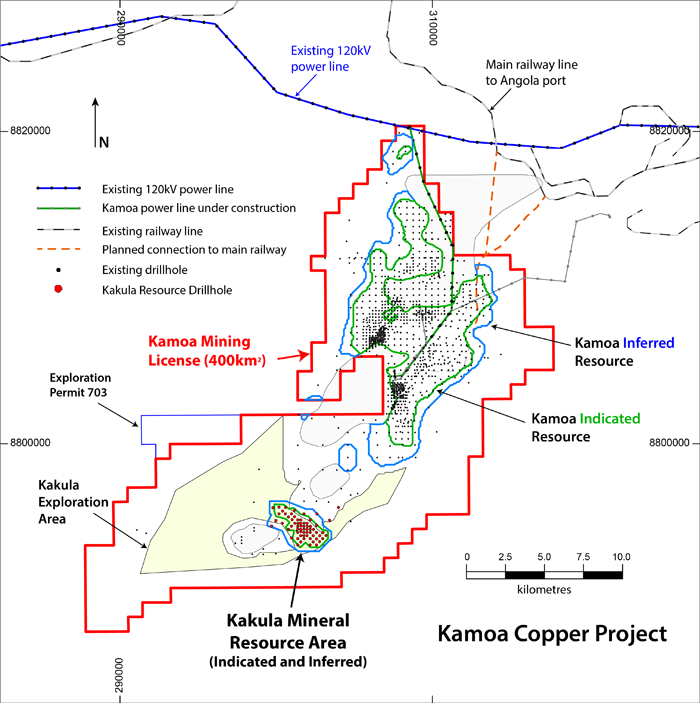
Figure 2. Kakula Exploration Area showing grade of Indicated and Inferred Resource blocks at a 3% selective mineralized zone cut-off.
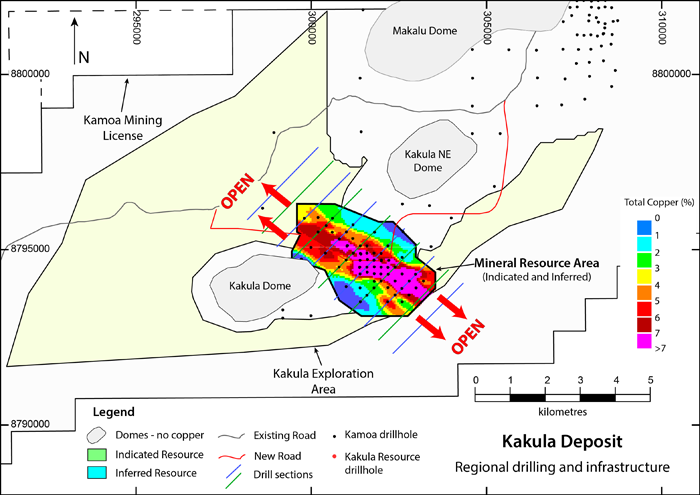
Figure 3. Average grades of Indicated and Inferred blocks in Kakula’s 3% selective mineralized zone.
The Indicated and Inferred Resource perimeters indicate a confidence classification. Cut-off criteria are applied within the perimeters to state Mineral Resources.
Figure 4. Average true thickness of Kakula’s 3% selective mineralized zone Indicated and Inferred blocks.
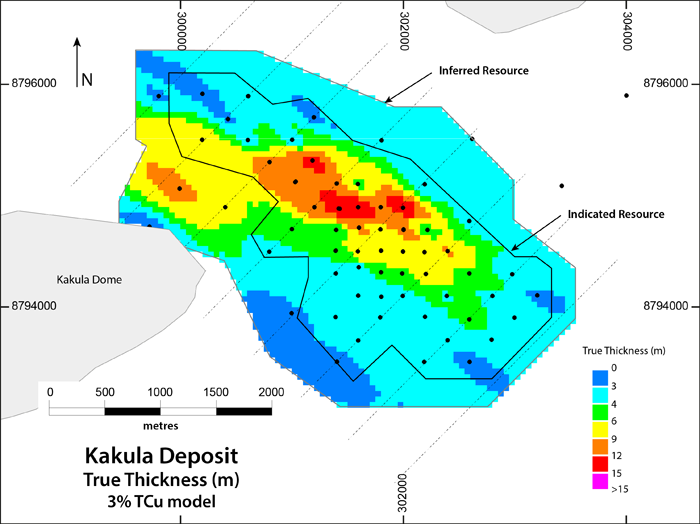
The Indicated and Inferred Resource perimeters indicate a confidence classification. Cut-off criteria are applied within the perimeters to state Mineral Resources.
Figure 5. Average grades of Indicated and Inferred blocks in Kakula’s 1% selective mineralized zone.
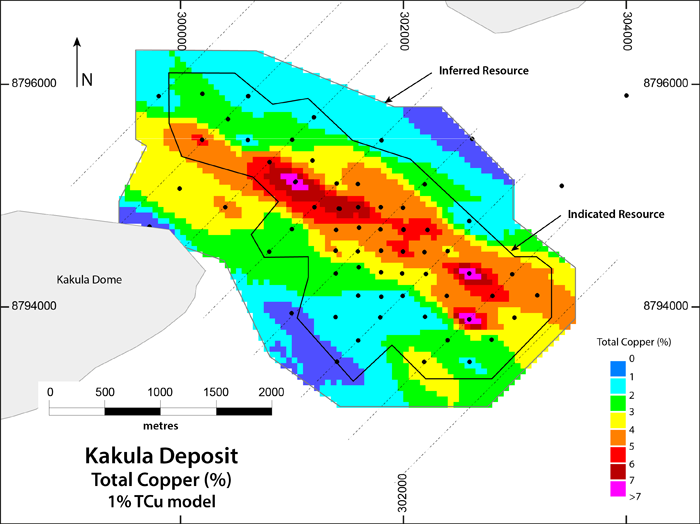
The Indicated and Inferred Resource perimeters indicate a confidence classification. Cut-off criteria are applied within the perimeters to state Mineral Resources.
Figure 6. Average true thickness of Kakula’s 1% selective mineralized zone Indicated and Inferred blocks.
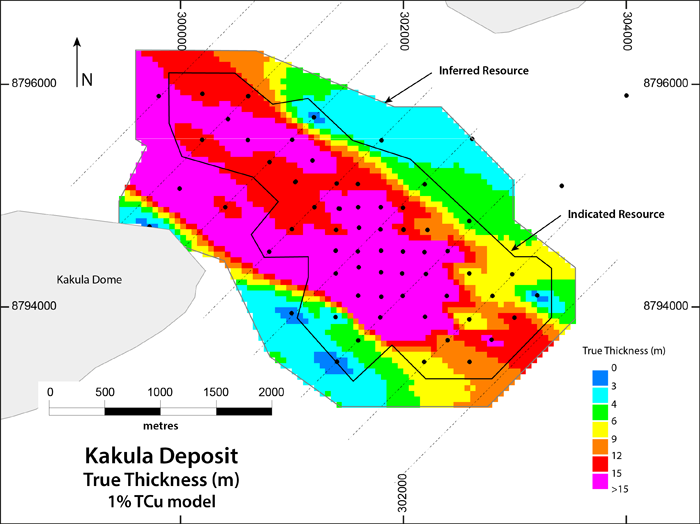
The Indicated and Inferred Resource perimeters indicate a confidence classification. Cut-off criteria are applied within the perimeters to state Mineral Resources.
Kakula’s newly defined resources add to an already world-class resource base at the Kamoa-Kakula Project
Kakula’s estimated resources are in addition to the Mineral Resources delineated elsewhere on the Kamoa mining licence that were disclosed by Ivanhoe Mines in a news release on February 23, 2016.
The combined Kamoa-Kakula Indicated Mineral Resources now total 944 million tonnes grading 2.83% copper, containing 58.9 billion pounds of copper at a 1.0% copper cut-off grade and a minimum thickness of three metres.
Kamoa-Kakula now also has Inferred Mineral Resources of 286 million tonnes grading 2.31% copper and containing 14.6 billion pounds of copper, also at a 1.0% copper cut-off grade and a minimum thickness of three metres.
The total consolidated Mineral Resource for the Kamoa-Kakula Project is shown in Table 4 and the sensitivity of the resource at various cut-offs is shown in Table 5.
Table 4. Consolidated Mineral Resource Statement, Kamoa-Kakula Project – October 9, 2016, 1% copper cut-off over minimum thickness of 3 metres.
| Deposit | Category | Tonnes (millions) |
Area (Sq. km) |
Copper Grade | True Thickness (metres-m) |
Contained Copper (kTonnes) |
Contained Copper (billion lbs) |
|---|---|---|---|---|---|---|---|
| Kamoa | Indicated | 752 | 50.5 | 2.67% | 5.2 (m) | 20,110 | 44.3 |
| Inferred | 185 | 16.8 | 2.08% | 3.8 (m) | 3,840 | 8.5 | |
| Kakula | Indicated | 192 | 4.6 | 3.45% | 14.3 (m) | 6,630 | 14.6 |
| Inferred | 101 | 3.3 | 2.74% | 10.3 (m) | 2,763 | 6.1 | |
| Total Kamoa Project |
Indicated | 944 | 55.1 | 2.83% | 6.0 (m) | 26,740 | 58.9 |
| Inferred | 286 | 20.1 | 2.31% | 4.9 (m) | 6,603 | 14.6 |
Notes to Accompany Kamoa Project Mineral Resource Table:
- Ivanhoe’s Mineral Resources Manager, George Gilchrist, Professional Natural Scientist (Pr. Sci. Nat) with the South African Council for Natural Scientific Professions (SACNASP), estimated the Mineral Resources under the supervision of Dr. Harry Parker and Gordon Seibel, both RM of Society of Mining, Metallurgy and Exploration (SME), who are the Qualified Persons for the Mineral Resource estimate. The effective date of the estimate is 9 October 2016. Mineral Resources are estimated using the 2014 CIM Definition Standards for Mineral Resources and Mineral Reserves.
- Mineral Resources are estimated assuming underground mining methods, a copper price of US$3.30/lb (Kamoa) and US$3.00/lb (Kakula Discovery), a cut-off of 1% total copper, a minimum thickness of 3 m, and that concentrates will be produced and sent to a smelter.
- Tonnage and contained-copper tonnes are reported in metric units, contained-copper pounds are reported in imperial units and grades are reported as percentages.
- Rounding as required by reporting guidelines may result in apparent summation differences between tonnes, grade and contained metal content.
Table 5. Indicated and Inferred Mineral Resources, Kamoa-Kakula Project – October 9, 2016.
| Category | Cut-off Grade (Cu%) |
Tonnes (millions) |
Area (Sq. km) |
Copper Grade | Contained Copper (kTonnes) |
Contained Copper (billion lbs) |
|---|---|---|---|---|---|---|
| Indicated | 3.0 | 304 | 18.0 | 4.43% | 13,471 | 29.7 |
| Indicated | 2.5 | 458 | 27.9 | 3.86% | 17,669 | 39.0 |
| Indicated | 2.0 | 665 | 38.7 | 3.37% | 22,384 | 49.3 |
| Indicated | 1.5 | 825 | 48.2 | 3.05% | 25,179 | 55.5 |
| Indicated | 1.0 | 944 | 55.1 | 2.83% | 26,740 | 58.9 |
| Category | Cut-off Grade (Cu%) |
Tonnes (millions) |
Area (Sq. km) |
Copper Grade | Contained Copper (kTonnes) |
Contained Copper (billion lbs) |
|---|---|---|---|---|---|---|
| Inferred | 3.0 | 47 | 3.5 | 4.50% | 2,145 | 4.8 |
| Inferred | 2.5 | 83 | 6.1 | 3.74% | 3,107 | 6.9 |
| Inferred | 2.0 | 144 | 9.8 | 3.12% | 4,488 | 9.8 |
| Inferred | 1.5 | 211 | 14.5 | 2.67% | 5,652 | 12.4 |
| Inferred | 1.0 | 286 | 20.1 | 2.31% | 6,603 | 14.6 |
Kamoa-Kakula now ranks among the world’s 10 largest copper deposits
The initial Kakula estimate vaults the Kamoa-Kakula Project into the ranks of the 10 largest copper deposits ever discovered in the world – and its copper grades are the highest, by a wide margin, of the copper world’s top 10 (see Figure 7). Significantly, both the Kakula Discovery and Kamoa’s earlier Kansoko Discovery continue to remain open for expansion in numerous directions.
Research by Wood Mackenzie also shows that the Kamoa-Kakula Project’s distinctions include the world’s largest, high-grade (>2.5% copper) copper deposit and the world’s largest, undeveloped copper deposit, based on contained copper in the project’s Measured and Indicated Resources.
Figure 7. Among the world’s largest copper deposits by contained copper, Kamoa-Kakula has the highest copper grades by a wide margin.
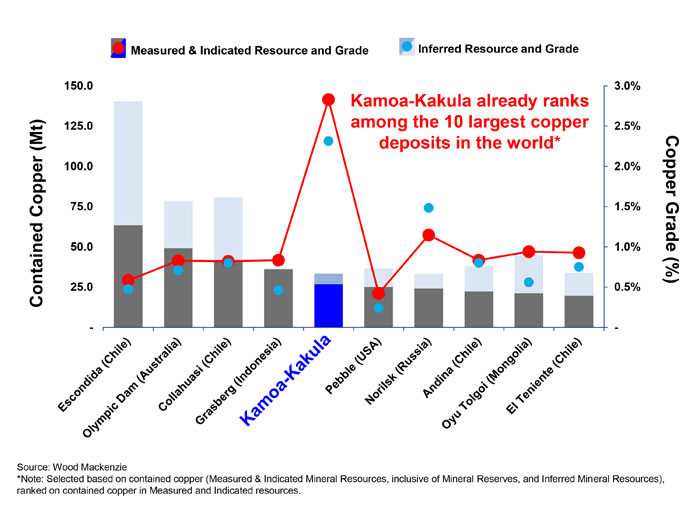
Figure 8. World’s largest undeveloped copper deposits.
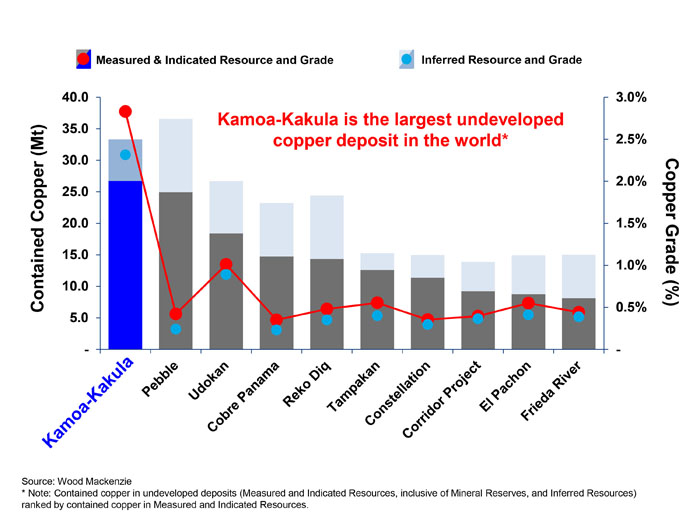
Figure 9. World’s largest high-grade (above 2.5% copper) copper deposits.
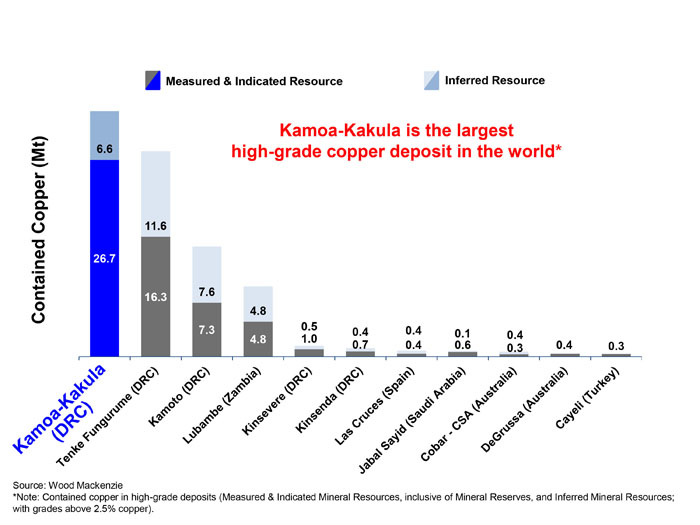
Figure 10. Central African Copperbelt discoveries, ranked by resources and historical production.
Preliminary Economic Assessment underway for a four-million-tonne-per-year mine and mill at Kakula
With the initial Kakula estimate completed, Kamoa Copper has retainedOreWin Pty. Ltd., of Adelaide, Australia, to prepare a Preliminary Economic Assessment (PEA) for the development of the Kakula deposit. The PEA, which is expected to be completed before the end of 2016, will concentrate on establishing the economic parameters of potential mining operations at Kakula, including capital and operating costs for an underground mine.
The PEA also will analyze process facilities, mining planning and scheduling, including capital costs and operating costs for both mining and concentrator operations. The PEA will draw on recommendations from the Kamoa 2016 pre-feasibility study, including the potential to increase production up to four million tonnes per year from the proposed initial mining area.
Kakula mineralization is characteristically bottom loaded. The resource estimate demonstrates that opportunities exist to mine Kakula at much higher lateral and vertical cut-offs than at Kamoa’s Kansoko Sud. The clear zonation and grades in the central high-grade core should provide sequencing opportunities to mine at significantly elevated grades.
“The Kakula PEA will allow Kamoa’s engineers and consultants to maximize opportunities for project enhancements as we move the Kamoa-Kakula Project forward,” said Mr. Johansson.
To help advance the mine-planning work at Kakula, the Kamoa technical team is rapidly proceeding with the engineering and construction of a box cut at Kakula to accommodate decline ramps that will provide underground access to the deposit.
Kakula’s chalcocite-dominant mineralogy expected to produce very-high-value, low-arsenic concentrate
The initial metallurgical test results received in July 2016 from a sample of drill core from the Kakula Discovery zone achieved copper recoveries of 86% and produced a copper concentrate with an extremely high grade of 53% copper. The July results also indicated that material from Kamoa’s Kakula and Kansoko zones could be processed through the same concentrator plant, which could yield significant operational and economic efficiencies.
Earlier metallurgical testwork indicated that the Kamoa concentrates contain arsenic levels that are extremely low by world standards – approximately 0.02%. Given this critical competitive marketing advantage, Kamoa-Kakula concentrates are expected to attract a significant premium from copper-concentrate traders for use in blending with concentrates from other mines. The Kamoa-Kakula concentrates will help to enable high-arsenic concentrates from mines in Chile and elsewhere to meet the limit of 0.5% arsenic imposed by Chinese smelters, via blending, to meet China’s new environmental restrictions.
Qualified Person and Quality Control and Assurance
The independent qualified persons for the Kakula Mineral Resource estimate are Dr. Harry Parker and Gordon Seibel, both of Amec Foster Wheeler.
Other scientific and technical information in this news release has been reviewed and approved by Stephen Torr, P.Geo., Ivanhoe Mines’ Vice President, Project Geology and Evaluation, a Qualified Person under the terms of National Instrument 43-101. Mr. Torr is not independent of Ivanhoe Mines. Mr. Torr has verified the technical data disclosed in this news release not related to the current Mineral Resource estimate disclosed herein.
Ivanhoe Mines maintains a comprehensive chain of custody and QA/QC program on assays from its Kamoa-Kakula Project. Half-sawn core is processed at the Kamoa-Kakula on-site preparation laboratory and prepared samples then are shipped by secure courier to Bureau Veritas Minerals (BVM) Laboratories in Australia, an ISO17025-accredited facility. Copper assays are determined at BVM by mixed-acid digestion with ICP finish. Industry-standard certified reference materials and blanks are inserted into the sample stream prior to dispatch to BVM. For detailed information about assay methods and data verification measures used to support the scientific and technical information, please refer to the current technical report on the Kamoa Copper Project on the SEDAR profile of Ivanhoe Mines at www.sedar.com.
Ivanhoe Mines will be filing a NI 43-101 Technical Report in respect of the current Mineral Resource estimate disclosed herein, within 45 days of this news release.
Data verification
Dr. Parker and Mr. Seibel, (collectively the Amec Foster Wheeler QPs), reviewed the sample chain-of-custody, quality-assurance and quality-control (QA/QC) procedures, and the accreditations of analytical laboratories used by Ivanhoe. The Amec Foster Wheeler QPs are of the opinion that the procedures and QA/QC are acceptable to support Mineral Resource estimation. Amec Foster Wheeler also audited the assay database, core logging and geological interpretations and found no material issues with the data as a result of these audits.
In the opinion of the Amec Foster Wheeler QPs, the data verification programs undertaken on the geological and assay data collected from the Kakula Discovery support the geological interpretations and the analytical and database quality, and the data collected, can support Mineral Resource estimation.
About Ivanhoe Mines
Ivanhoe Mines is advancing its three principal projects in Sub-Saharan Africa: Mine development at the Platreefplatinum-palladium-gold-nickel-copper discovery on the Northern Limb of South Africa’s Bushveld Complex; mine development and exploration at the Kamoa-KakulaCopper Project on the Central African Copperbelt in the DRC; and upgrading at the historic, high-grade Kipushizinc-copper-lead-germanium mine, also on the DRC’s Copperbelt. For details, visit www.ivanhoemines.com.
Information contacts
Investors
Bill Trenaman +1.604.331.9834
Media
North America: Bob Williamson +1.604.512.4856
South Africa: Jeremy Michaels +27.82.939.4812
Cautionary statement on forward-looking information
Certain statements in this release constitute “forward-looking statements” or “forward-looking information” within the meaning of applicable securities laws, including without limitation, the timing and results of (1) statements regarding the evaluation of technical and infrastructure options to rapidly advance the development of the near-surface, highest-grade copper resources at Kakula; (2) mine planning focusing on how to expeditiously develop the zones of thick, bottom-loaded chalcocite, grading in excess of 6% copper, near the centre of Kakula’s high-grade area; (3) statements regarding Ivanhoe being highly confident that fast-tracking the development of Kakula will have a profound and positive impact on the economics of the overall Kamoa-Kakula Project; (4) statements regarding the Kakula drilling program will continue into 2017 and its expansion to 60,000m; (5) statements regarding the high-grade Kakula Discovery presents game-changing opportunities for Kamoa-Kakula development; (6) statements regarding the bottom-loaded mineralization at Kakula will support the construction of selective mineralized zone (SMZ) composites at cut-offs up to at least 3% copper; (7) statements regarding there being considerable potential for resource expansion within the Kakula Exploration Area; (8) statements regarding the bottom-loaded nature of the gently-dipping, stratabound chalcocite mineralization at Kakula offers the potential for selective, mechanized, underground mining at copper grades greater than 7% copper; (9) statements regarding the expectation that the Kakula PEA will be completed before the end of 2016; (10) statements regarding the Kakula PEA will draw on recommendations from the Kamoa 2016 pre-feasibility study, including the potential to increase production up to 4 Mtpa from the proposed initial mining area; (11) statements regarding clear zonation and grades in the central high-grade core at Kakula should provide sequencing opportunities to mine at significantly elevated grades; (12) statements regarding material from Kamoa’s Kakula and Kansoko zones could be processed through the same concentrator plant, which could yield significant operational and economic efficiencies; and (13) statements regarding that Kamoa-Kakula concentrates are expected to attract a significant premium from copper-concentrate traders for use in blending with concentrates from other mines and that the Kamoa-Kakula concentrates will help to enable high-arsenic concentrates from mines in Chile and elsewhere to meet the limit of 0.5% arsenic imposed by Chinese smelters, via blending, to meet China’s new environmental restrictions.
Such statements involve known and unknown risks, uncertainties and other factors which may cause the actual results, performance or achievements of the company, or industry results, to be materially different from any future results, performance or achievements expressed or implied by such forward-looking statements or information. Such statements can be identified by the use of words such as “may”, “would”, “could”, “will”, “intend”, “expect”, “believe”, “plan”, “anticipate”, “estimate”, “scheduled”, “forecast”, “predict” and other similar terminology, or state that certain actions, events or results “may”, “could”, “would”, “might” or “will” be taken, occur or be achieved. These statements reflect the company’s current expectations regarding future events, performance and results and speak only as of the date of this release.
All such forward-looking information and statements are based on certain assumptions and analyses made by Ivanhoe Mines’ management in light of their experience and perception of historical trends, current conditions and expected future developments, as well as other factors management believe are appropriate in the circumstances. These statements, however, are subject to a variety of risks and uncertainties and other factors that could cause actual events or results to differ materially from those projected in the forward-looking information or statements including, but not limited to, unexpected changes in laws, rules or regulations, or their enforcement by applicable authorities; the failure of parties to contracts to perform as agreed; social or labour unrest; changes in commodity prices, including the price of copper; unexpected failure or inadequacy of infrastructure, or delays in the development of infrastructure, the failure of exploration programs or other studies to deliver anticipated results or results that would justify and support continued studies, development or operations, and the results of economic studies and evaluations. Other important factors that could cause actual results to differ from these forward-looking statements also include those described under the heading “Risk Factors” in the company’s most recently filed MD&A as well as in the most recent Annual Information Form filed by Ivanhoe Mines. Readers are cautioned not to place undue reliance on forward-looking information or statements. The factors and assumptions used to develop the forward-looking information and statements, and the risks that could cause the actual results to differ materially are set forth in the “Risk Factors” section and elsewhere in the company’s most recent Management’s Discussion and Analysis report and Annual Information Form, available at www.sedar.com.
This news release also contains references to estimates of Mineral Resources. The estimation of Mineral Resources is inherently uncertain and involves subjective judgments about many relevant factors. Mineral Resources that are not Mineral Reserves do not have demonstrated economic viability. The accuracy of any such estimates is a function of the quantity and quality of available data, and of the assumptions made and judgments used in engineering and geological interpretation, which may prove to be unreliable and depend, to a certain extent, upon the analysis of drilling results and statistical inferences that may ultimately prove to be inaccurate. Mineral Resource estimates may have to be re-estimated based on, among other things: (i) fluctuations in copper prices or other mineral prices; (ii) results of drilling; (iii) results of metallurgical testing and other studies; (iv) changes to proposed mining operations, including dilution; (v) the evaluation of mine plans subsequent to the date of any estimates; and (vi) the possible failure to receive required permits, approvals and licences, or changes to any such permits, approvals or licence.
Although the forward-looking statements contained in this news release are based upon what management of the company believes are reasonable assumptions, the company cannot assure investors that actual results will be consistent with these forward-looking statements. These forward-looking statements are made as of the date of this news release and are expressly qualified in their entirety by this cautionary statement. Subject to applicable securities laws, the company does not assume any obligation to update or revise the forward-looking statements contained herein to reflect events or circumstances occurring after the date of this news release.